- Ena Source Monthly Newsletter
- Posts
- Monthly Supply Chain Pulse - 30
Monthly Supply Chain Pulse - 30
📰 Supply Chain Pulse | Monthly Edition – May 11, 2026
Your Go-To Source for Supply Chain Insights, Trends, and Actionable Advice
Four straight months of manufacturing expansion, a PMI at its strongest since 2022, and new orders climbing, May has some genuinely good news. But good news and rising costs have a way of arriving together, and this month is no exception. Here's your breakdown.
📊 Key Metrics
Staying competitive means keeping an eye on the data that matters most. Here are six supply chain metrics we monitor and update each month.
🛳️ Drewry World Container Index (WCI)
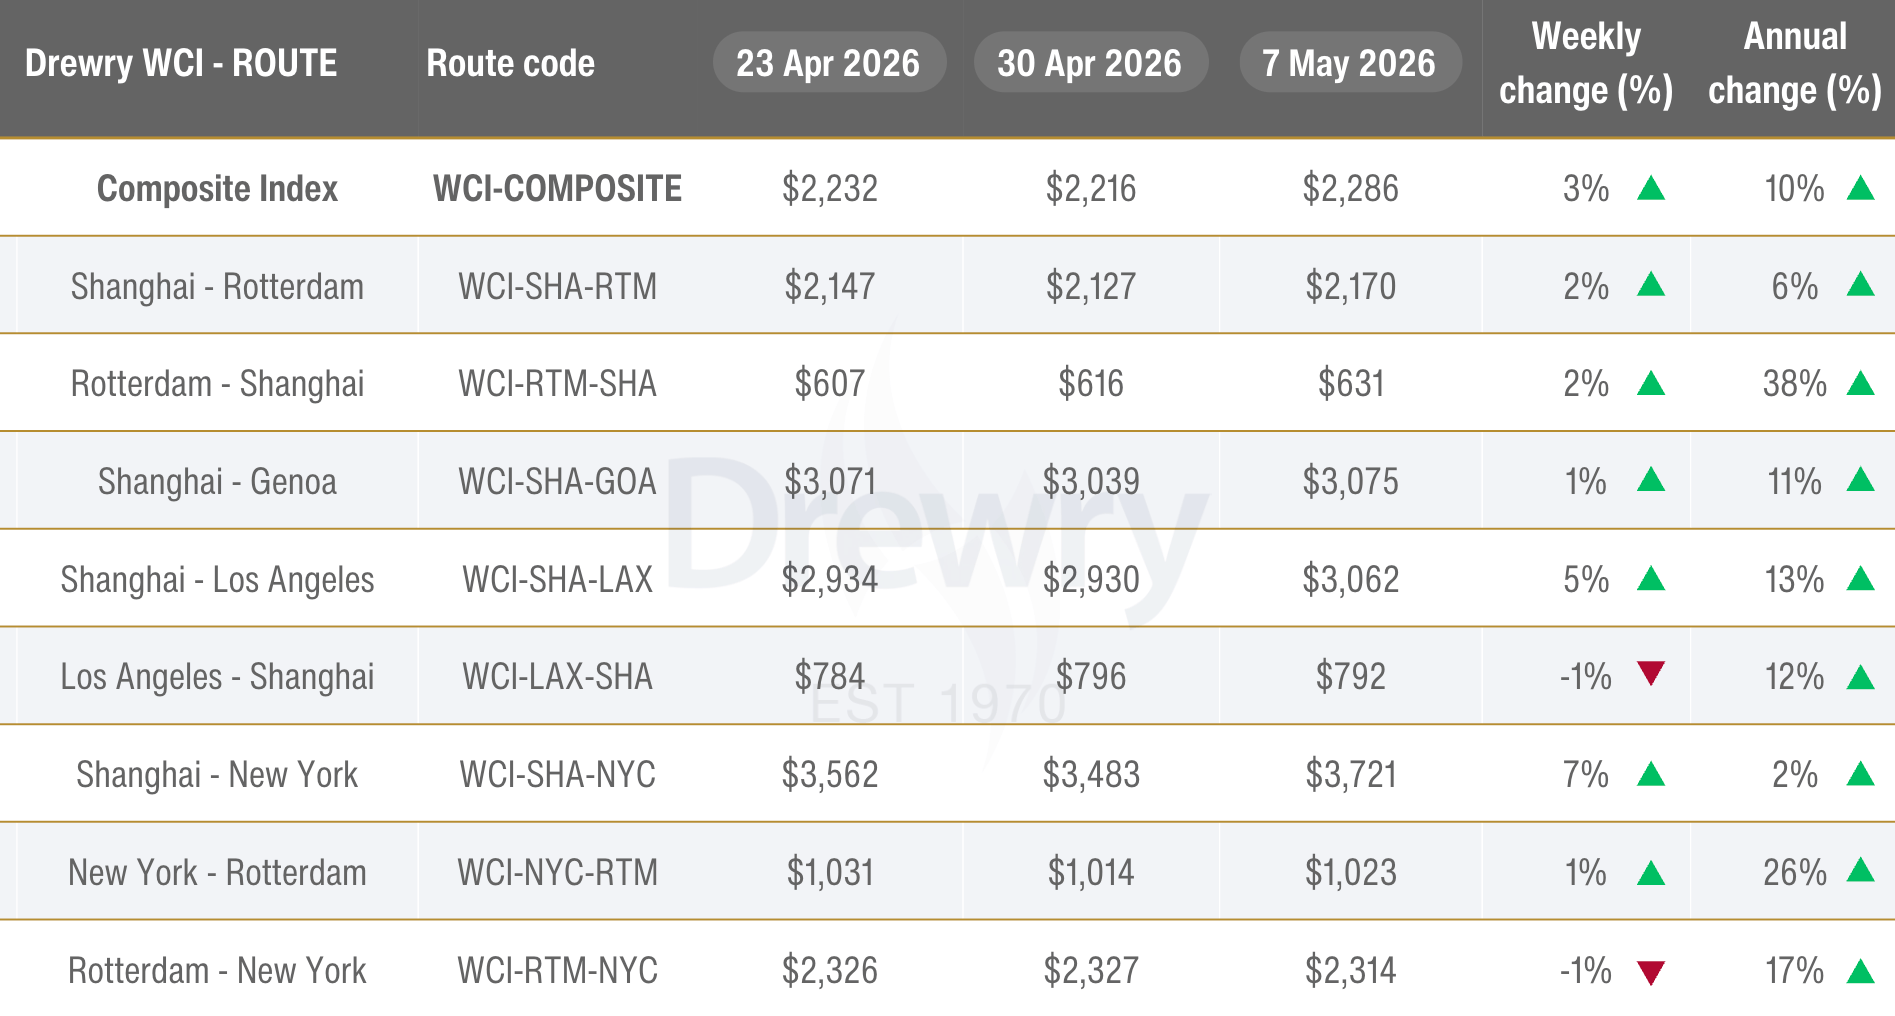
Click Chart To See Full Table
The 40ft rate from Shanghai to New York edged up to $3,721 this month, a modest 1.4% increase from April's $3,671, but the relative stability in the headline rate masks what's actually happening beneath it. Carriers are layering on surcharges aggressively. For example, MSC raised its Emergency Fuel Surcharge on Asia-to-U.S. East Coast routes from $430 to $644 per 40ft container, and CMA CGM introduced a new Peak Season Surcharge of $2,000 per 40ft effective May 1, meaning your all-in cost per container is rising well beyond what the base rate suggests. Drewry expects rates to increase further in the coming weeks as these surcharges take full effect, so the relatively flat headline number this month should not be mistaken for stability.
🚚 DAT Truckload Freight Rate Index
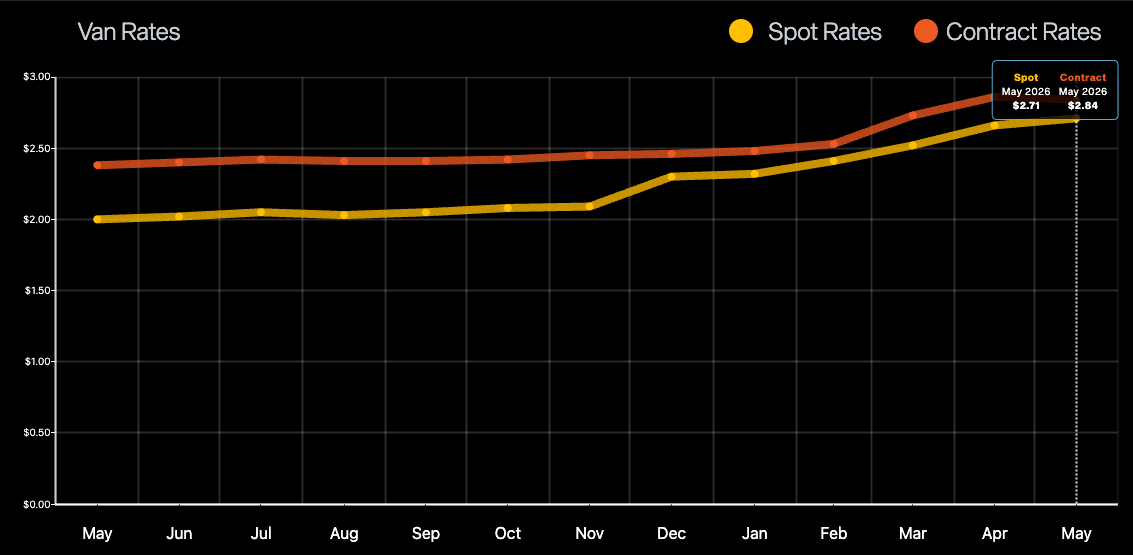
Click Chart To See Full Index
Van spot rates pulled back slightly to $2.71 per mile this month, down marginally from $2.73 in April, but this is not a signal of softening, it is a brief pause in a market that remains under significant pressure. Diesel is currently averaging $5.40 per gallon nationally, up 33 cents from last month and $1.86 higher than this time last year, meaning fuel surcharges are still actively building into your freight costs. Rates are also running 27% higher year over year according to DAT.
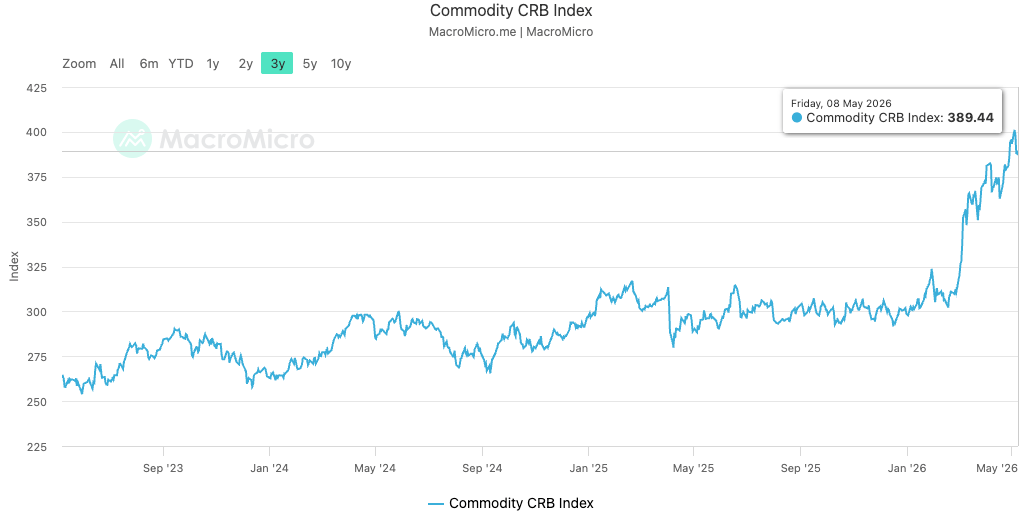
🛢 Commodity Research Bureau (CRB) Index
Click Chart To See Full Index
The CRB index measures a basket of 19 commodities including energy, agriculture, and metals. It’s widely considered a leading indicator of inflation, economic health, and overall cost trends for goods across the market. An increase tends to signify an increase in economic activity while a decrease tends to signify a slowdown in economic activity.
The CRB Index climbed to 389.44 this month, up 6.3% from 366.27 in April and now running 28% higher than this time last year, putting it at levels not seen since the commodity supercycle of 2008, when the all-time high of 473.97 was set. WTI crude broke above $107 per barrel in early May, keeping energy as the primary engine, but the index is now receiving meaningful contributions from metals and agricultural inputs as well, confirming that this is a broad-based commodity inflation story rather than an oil-specific one. If your suppliers haven't sent price adjustment notices yet, this data suggests they are building the case to do so. The CRB consistently leads supplier price lists by 30–60 days, and at 389 and climbing, that conversation is likely coming.
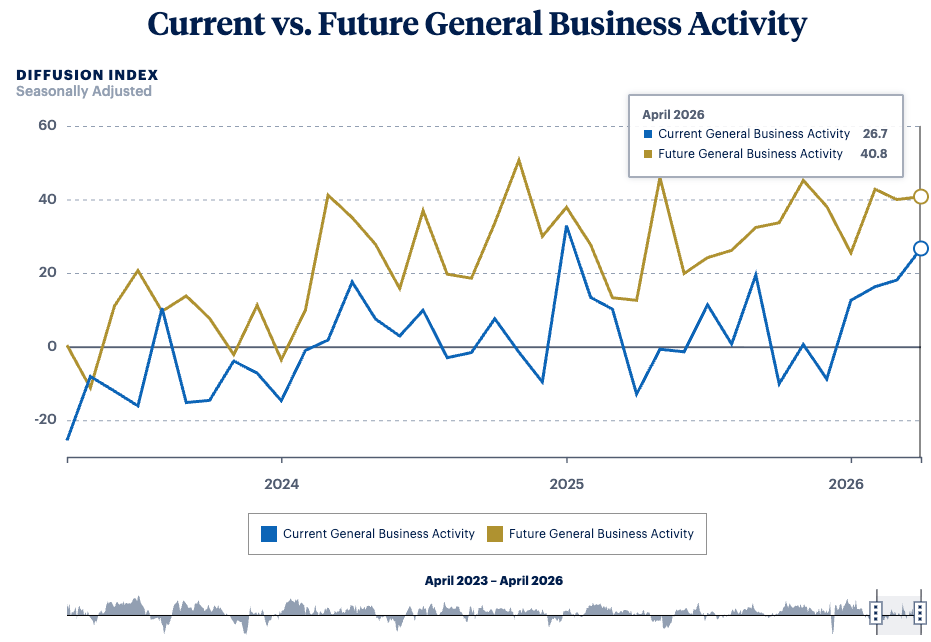
🇺🇸 🏭 Philadelphia Fed Manufacturing Index
Click Chart To See Full Index
To create this index, the Federal Reserve Bank of Philadelphia surveys around 250 manufacturers, asking about factors like employment, working hours, new and unfilled orders, shipments, inventory levels, delivery times, prices, costs, and business forecasts for the next six months. An index level above zero signifies improving conditions, while a level below zero indicates worsening conditions. Read more here.
The index surged to 26.7 in April, its fourth consecutive increase and highest reading since January 2025, significantly beating analyst expectations of 10. With new orders jumping 24 points to 33.0 and shipments rising 12 points to 34.0, signaling that demand in the region is genuinely accelerating. The most critical data point this month is prices paid, which jumped 15 points to 59.3, its highest level since August, with over 61% of businesses now reporting input price increases, up sharply from 46% last month, and median energy cost expectations revised upward from 2–3% to 5–7.5% for 2026.
🧾 Purchasing Managers Index (PMI)
Click Chart To See Full Index
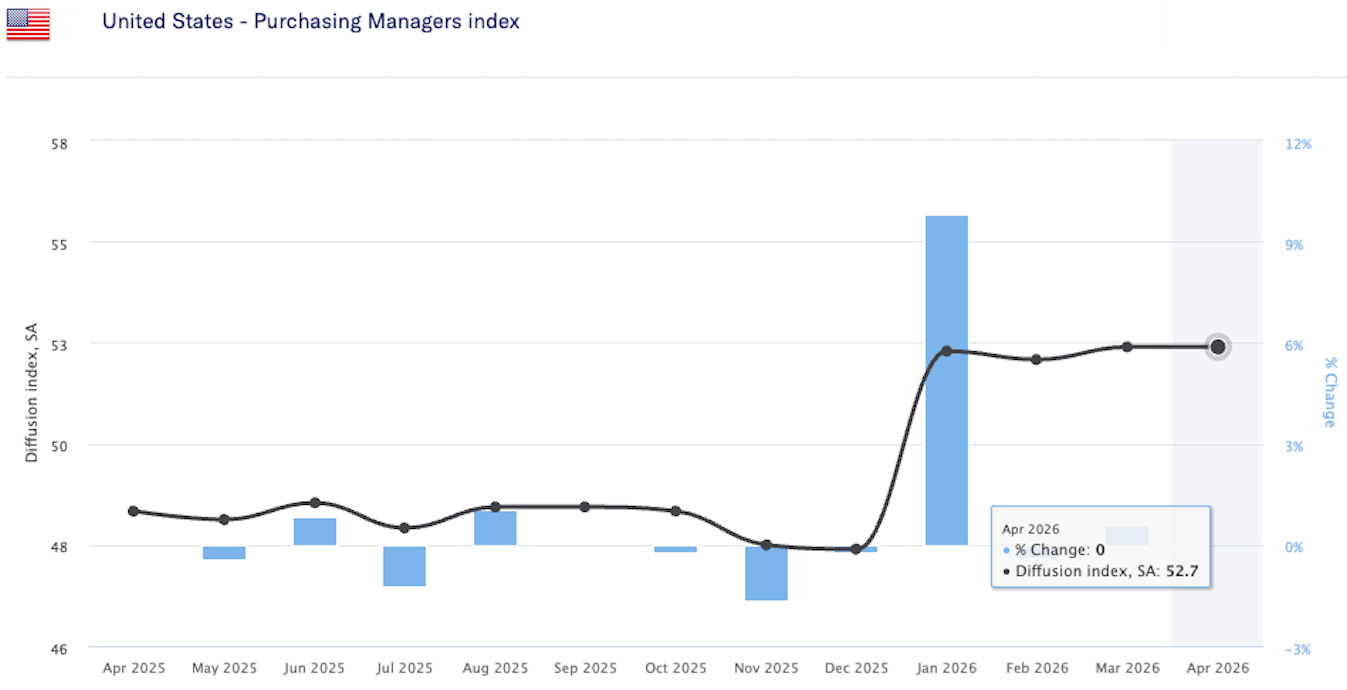
The PMI is an economic indicator derived from monthly surveys of private sector companies, measuring the performance of the manufacturing and services sectors. It covers metrics such as new orders, inventory levels, production, supplier deliveries, and employment. A PMI above 50 indicates expansion, while below 50 suggests contraction.
The April PMI held steady at 52.7%, unchanged from March and marking the fourth consecutive month of expansion, but the headline number is masking a significant shift underneath it. New orders grew at a faster pace (54.1%, up from 53.5%), but production slowed (53.4%, down from 55.1%), employment fell deeper into contraction at 46.4% (its worst reading in four months and the 31st consecutive month of decline), and supplier deliveries slowed further to 60.6%, signaling growing supply chain stress. The critical number this month is the Prices Index, which surged to 84.6%, which is up another 6.3 points from March's already alarming 78.3%, rising 25.6 percentage points in just three months to its highest level since April 2022. This is driven by steel, aluminum, petroleum-based products, and tariffs, with the Iran war cited in 47% of all panelist comments and 69% of overall sentiment negative. For manufacturers, the message is clear: demand is real, but costs are accelerating faster than most businesses can pass through, if you haven't revisited your pricing strategy and supplier contracts this quarter, you're already behind.
📈 🌎 GEP Global Supply Chain Volatility Index
Click Chart To See Full Index
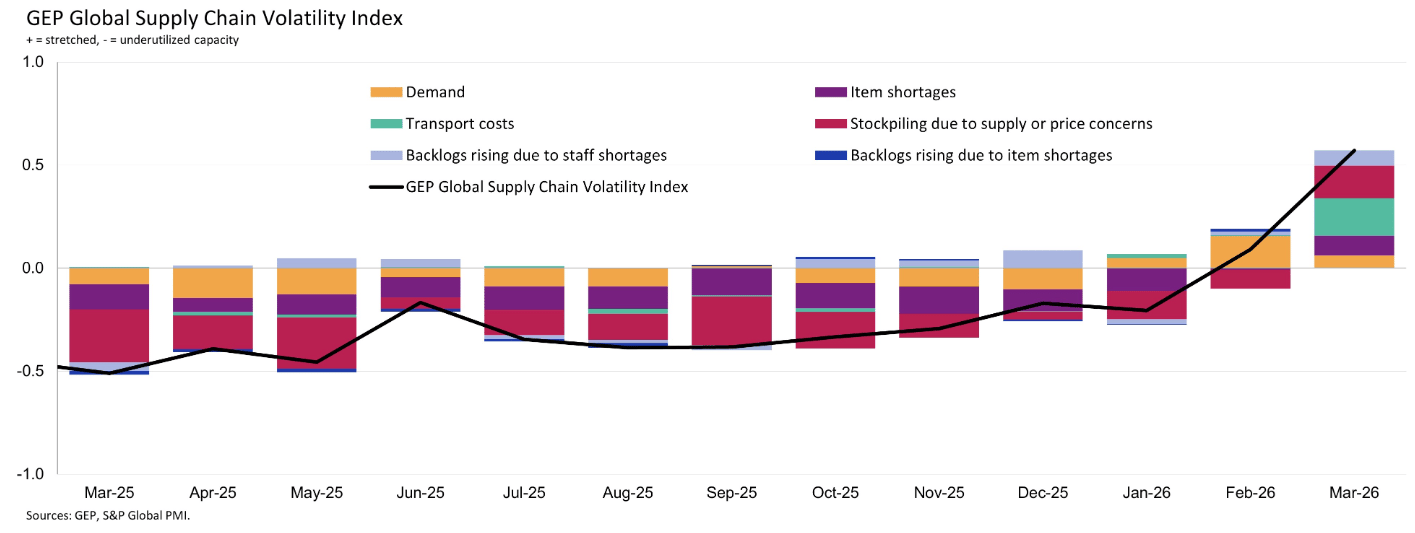
The GEP Global Supply Chain Volatility Index, produced by S&P Global and GEP, is a leading indicator derived from monthly surveys of approximately 27,000 businesses across 40+ countries, tracking demand conditions, shortages, transportation costs, inventories, and backlogs. A reading above zero signals that supply chain capacity is being stretched and volatility is increasing; a reading below zero indicates underutilized capacity and lower volatility.
The March Index surged from 0.09 in February to 0.57, a six-fold jump to its highest level since January 2023, as the Middle East conflict triggered an immediate and broad-based shock across global supply chains, pushing transportation costs to a four-year peak and material shortages to their highest level since April 2023. Manufacturers across all major regions responded by aggressively building inventory buffers, with safety stockpiling reports hitting a three-year high. This is a rational short-term response, but one that is itself tightening available supplier capacity and driving costs higher for everyone competing for the same components. For small and mid-size manufacturers in the Mid-Atlantic, the practical takeaway is this: global supply chain capacity is being stretched at the fastest rate in three years, meaning longer lead times, less pricing leverage with suppliers, and less margin for error on your inventory planning heading into summer.
🌍 Global Hot Topic: U.S. Manufacturing Imports Just Hit a Four-Year High (Click To Read Article)
Kearney's 2026 Reshoring Index, released April 29, delivers a sobering reality check: despite record levels of manufacturing investment and the most aggressive tariff regime in decades, the U.S. is actually more dependent on imported manufactured goods today than at any point in the last four years. Total U.S. manufacturing imports grew by $133 billion between 2024 and 2025, and the reshoring metric remained in negative territory, meaning offshoring is still winning. The report's lead author called the scale of supply chain reshuffling "staggering" and unlike anything seen in the index's 13-year history, but the critical detail is where production moved: not back to the U.S., but sideways to other low-cost Asian countries. China lost $135 billion in U.S. import share as tariffs bit hard, but the other 13 tracked Asian nations picked up $193 billion, meaning manufacturers pulled out of China and landed in Vietnam, India, Malaysia, and Taiwan instead. Only 20% of surveyed companies even considered domestic manufacturing as an option.
For small and mid-size manufacturers in the Mid-Atlantic, this data matters because it reframes the reshoring conversation entirely. The supply chain isn't coming home anytime soon, it's reorganizing across Asia, which means import dependency, freight exposure, and tariff risk aren't going away. The manufacturers who will win in this environment are those who actively manage their sourcing strategy rather than waiting for the market to shift in their favor.
🇺🇸 US Hot Topic: Trump Threatens 25% Tariff on EU Goods — July 4 Deadline Set (Click To Read Article)
President Trump escalated trade tensions with the European Union this week, threatening to raise tariffs on EU cars and trucks to 25%, up from the 15% cap agreed upon in last summer's Turnberry trade framework, accusing the bloc of failing to comply with the terms of the deal. Trump then followed up with a broader threat on Truth Social, giving the EU a July 4 deadline to ratify the agreement or face tariffs rising to "much higher" levels across all EU goods. The EU's European Commission president reaffirmed commitment to the deal and indicated "good progress is being made toward tariff reduction by early July," but the European Parliament has postponed its vote on the agreement, and the outcome remains uncertain. Adding to the instability, a U.S. trade court ruled just hours after Trump's latest threat that his 10% global surcharge was not justified under U.S. law, the second major legal blow to the administration's tariff authority this year.
For U.S. manufacturers, this matters even if you don't import from Europe. An escalating U.S.-EU trade dispute ripples across global industrial supply chains affecting components, raw materials, and finished goods that flow through European suppliers and distributors. It also adds yet another layer of policy uncertainty on top of an already complex tariff environment, making it harder to commit to long-term sourcing decisions with confidence. The manufacturers who will navigate this best are those who are actively mapping their exposure now rather than waiting for the next headline.
📈 Ena Monthly Stock Pick
$VDE — Vanguard Energy ETF is the best-performing Vanguard fund of 2026, up approximately 26% year to date while the broader S&P 500 has fallen nearly 4%. Every metric in this newsletter points back to energy as the root cause of rising supply chain costs, so owning a stake in the companies generating that revenue is one way to offset what you're absorbing on the cost side. Anchored by ExxonMobil and Chevron, both with 40+ year track records of dividend growth, VDE gives you diversified exposure to the energy sector at a rock-bottom 0.09% expense ratio and a 2.4% dividend yield.
As always, it’s not about timing the market, it’s about time in the market
Disclaimer: This is not financial advice or a recommendation for any investment. The content is for information purposes only, you should not construe any such information or other material as legal, tax, investment, financial, or other advice.
🚀 Your Supply Chain, Your Competitive Edge
Most manufacturers we talk to are leaving money on the table not because they aren't smart, but because sourcing is time-consuming, relationships get comfortable, and there's always something more urgent to deal with. That's exactly where we come in. Ena Source works as an embedded extension of your team, finding better suppliers, negotiating better prices, and building the kind of supply chain that stops being a problem and starts being an advantage. We work with small and mid-size manufacturers across the Mid-Atlantic, and our first conversation is always free.
📩 If something in this newsletter hit close to home, that's a good reason to reach out. Click here to book a meeting.
Check Out Previous Newsletters At Our Website!
