- Ena Source Monthly Newsletter
- Posts
- Monthly Supply Chain Pulse - 29
Monthly Supply Chain Pulse - 29
📰 Supply Chain Pulse | Monthly Edition – April 10, 2026
Your Go-To Source for Supply Chain Insights, Trends, and Actionable Advice
No easing into spring this year. The first week of April delivered a diesel price shock, rising ocean rates, and a significant tariff restructuring on steel, aluminum, and copper parts. Manufacturing is growing, but so are your costs. Let's break it down.
Follow us on LinkedIn!
📊 Key Metrics
Staying competitive means keeping an eye on the data that matters most. Here are six supply chain metrics we monitor and update each month.
🛳️ Drewry World Container Index (WCI)
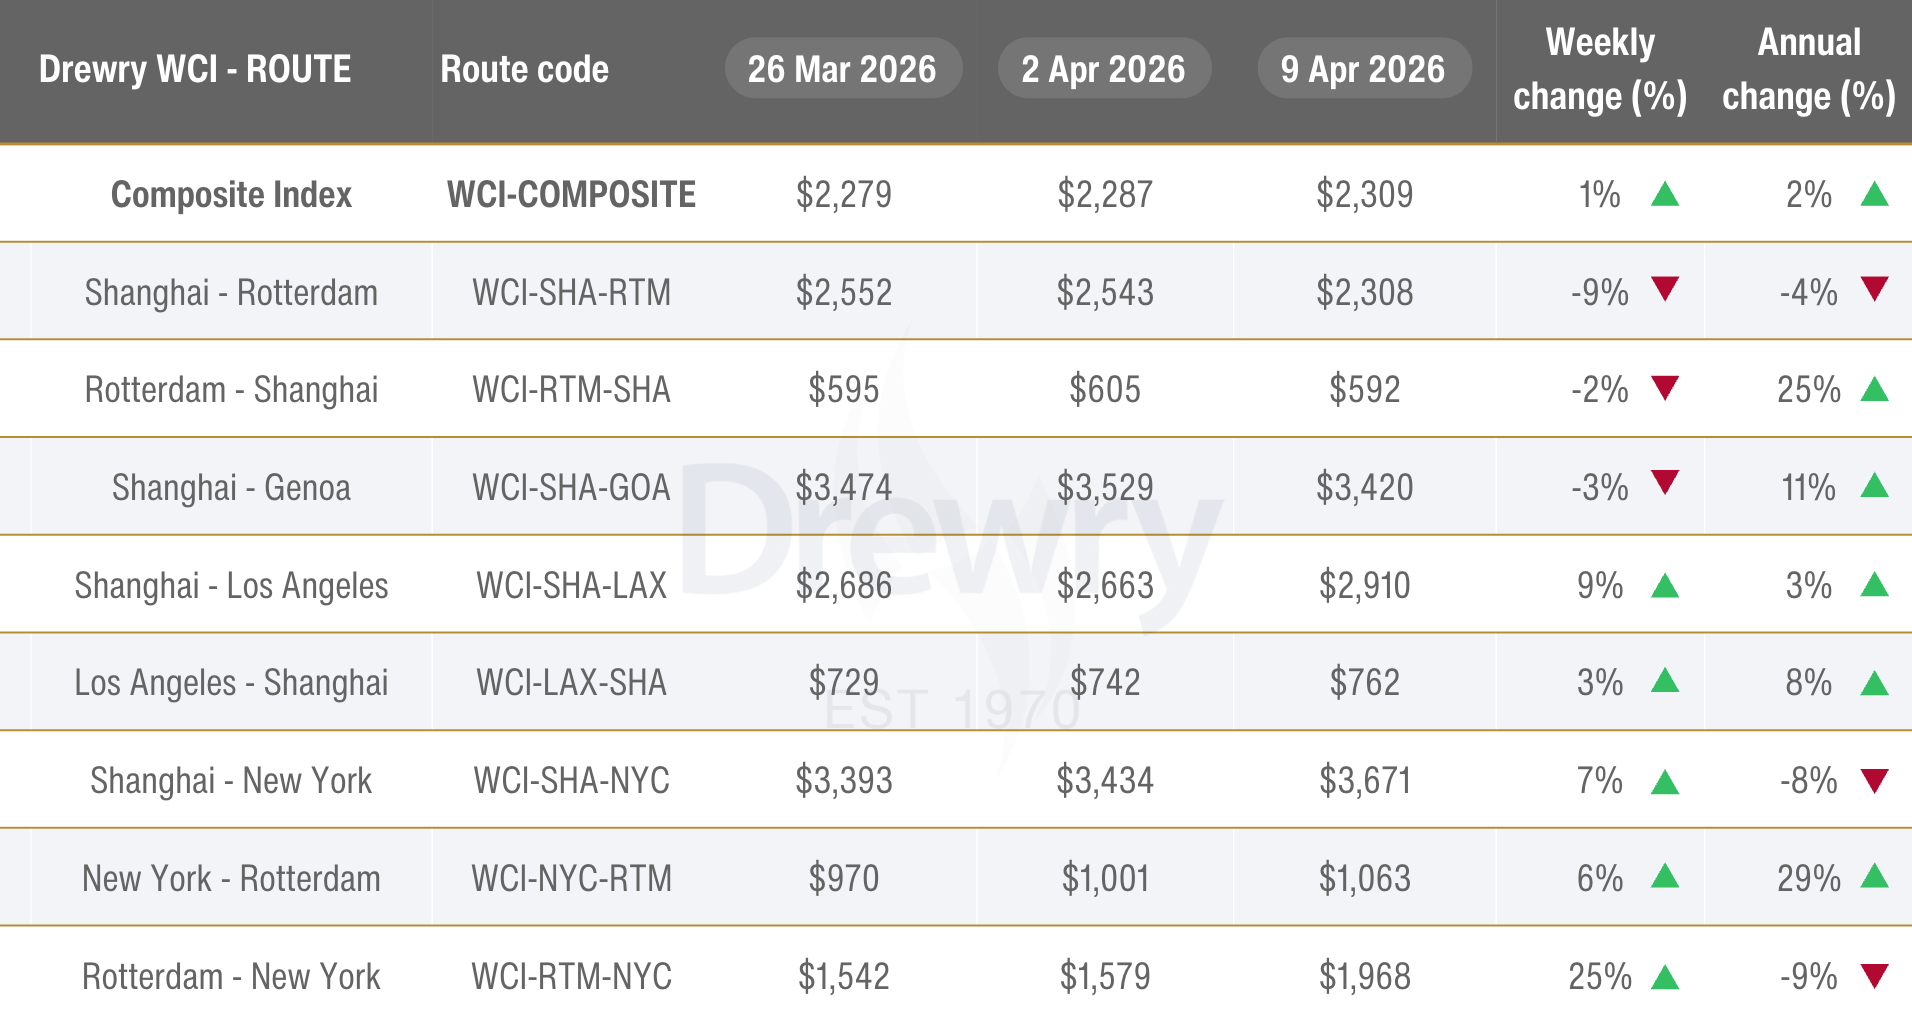
Click Chart To See Full Table
The 40ft rate from Shanghai to New York jumped to $3,671 this month, up from $2,977 last month, a 23.3% increase. The surge is being driven largely by escalating fuel costs following Middle East disruptions, with carriers like Maersk now implementing emergency bunker surcharges of $200/TEU on head-haul routes as fuel supplies tighten across major Asian hubs. Drewry expects rates to continue climbing in the near term until the energy situation stabilizes.
🚚 DAT Truckload Freight Rate Index
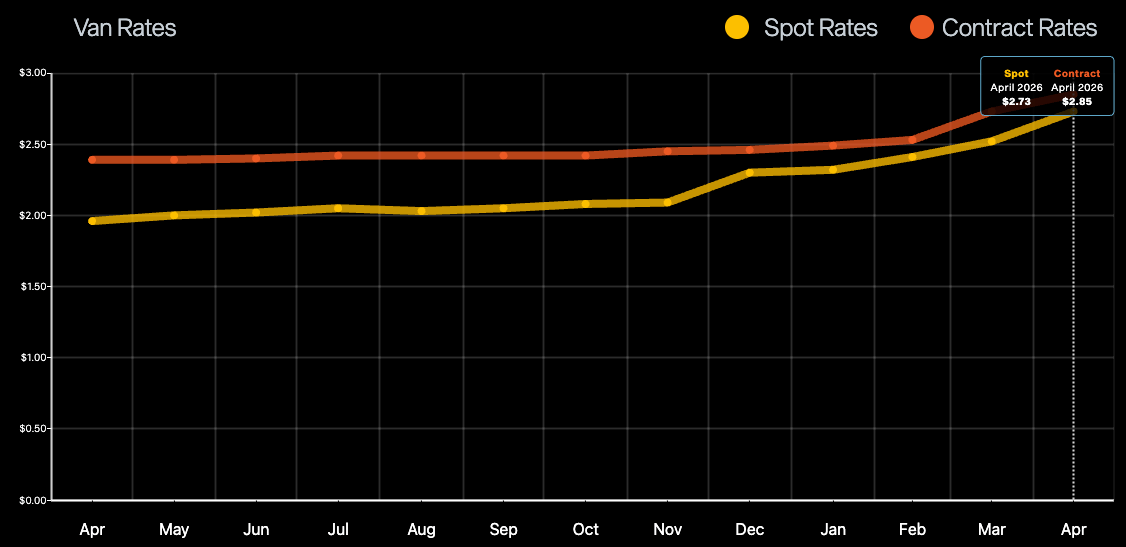
Click Chart To See Full Index
Van spot rates climbed to $2.73 per mile this month, continuing a trend that has now seen seven consecutive months of increases. The jump is being amplified by a record 96-cent single-week surge in diesel prices in early April, directly tied to Middle East conflict escalation and its impact on global oil markets. Fuel surcharges typically lag spot rates by 2–4 weeks, meaning the full cost impact on your freight invoices is likely still incoming.
🛢 Commodity Research Bureau (CRB) Index

Click Chart To See Full Index
The CRB index measures a basket of 19 commodities including energy, agriculture, and metals. It’s widely considered a leading indicator of inflation, economic health, and overall cost trends for goods across the market. An increase tends to signify an increase in economic activity while a decrease tends to signify a slowdown in economic activity.
The CRB Index rose to 366.27 this month, up 8.7% from 336.85 which is its highest level in at least 10 years, signaling that broad input cost pressure is building. Energy remains the primary driver, with oil crossing $100/barrel pushing petroleum-linked commodities higher, but the increase is beginning to spread into metals and industrial inputs as well, meaning this is no longer purely an oil story. The CRB tends to move before supplier price lists do, so if you haven't seen price adjustment notices from your material suppliers yet, expect them soon.
🇺🇸 🏭 Philadelphia Fed Manufacturing Index

Click Chart To See Full Index
To create this index, the Federal Reserve Bank of Philadelphia surveys around 250 manufacturers, asking about factors like employment, working hours, new and unfilled orders, shipments, inventory levels, delivery times, prices, costs, and business forecasts for the next six months. An index level above zero signifies improving conditions, while a level below zero indicates worsening conditions. Read more here.
The general activity index rose from 16.3 in February to 18.1 in March which is its third consecutive increase. This is attributed to shipments jumping 22 points to 22.2, its highest reading since January 2025, and new orders remaining positive at 8.6. Prices paid accelerated 6 points to 44.7, reversing last month's decline, and notably 54% of firms now expect energy markets to worsen over the next three months which is a direct signal of how Middle East disruptions are filtering into regional manufacturer sentiment. With 56% of firms expecting growth over the next six months, the outlook remains positive, but rising input costs and energy uncertainty are the risks to watch closely.
🧾 Purchasing Managers Index (PMI)
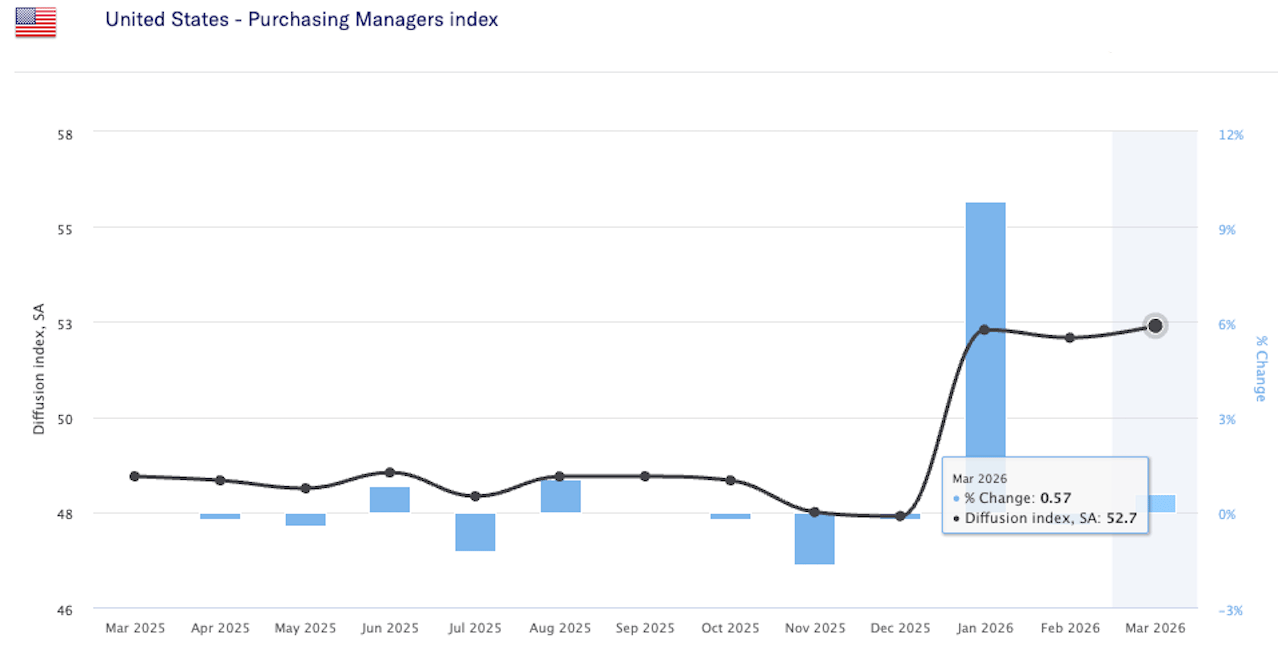
Click Chart To See Full Index
The PMI is an economic indicator derived from monthly surveys of private sector companies, measuring the performance of the manufacturing and services sectors. It covers metrics such as new orders, inventory levels, production, supplier deliveries, and employment. A PMI above 50 indicates expansion, while below 50 suggests contraction.
The March PMI came in at 52.7, up slightly from 52.4 in February and the strongest reading since August 2022, marking the third consecutive month of expansion. Production accelerated to 55.1 (up from 53.5), new orders remained positive at 53.5, but the headline this month is the Prices Index surging to 78.3% which is its highest level since June 2022 and up nearly 20 percentage points in just two months, with panelists explicitly citing the Iran war as a new cost driver for the first time. Employment (48.7) remains stubbornly in contraction for the 30th consecutive month, meaning manufacturers are absorbing more demand with the same or fewer workers, which is unsustainable if order volumes continue to climb.
📈 🌎 GEP Global Supply Chain Volatility Index
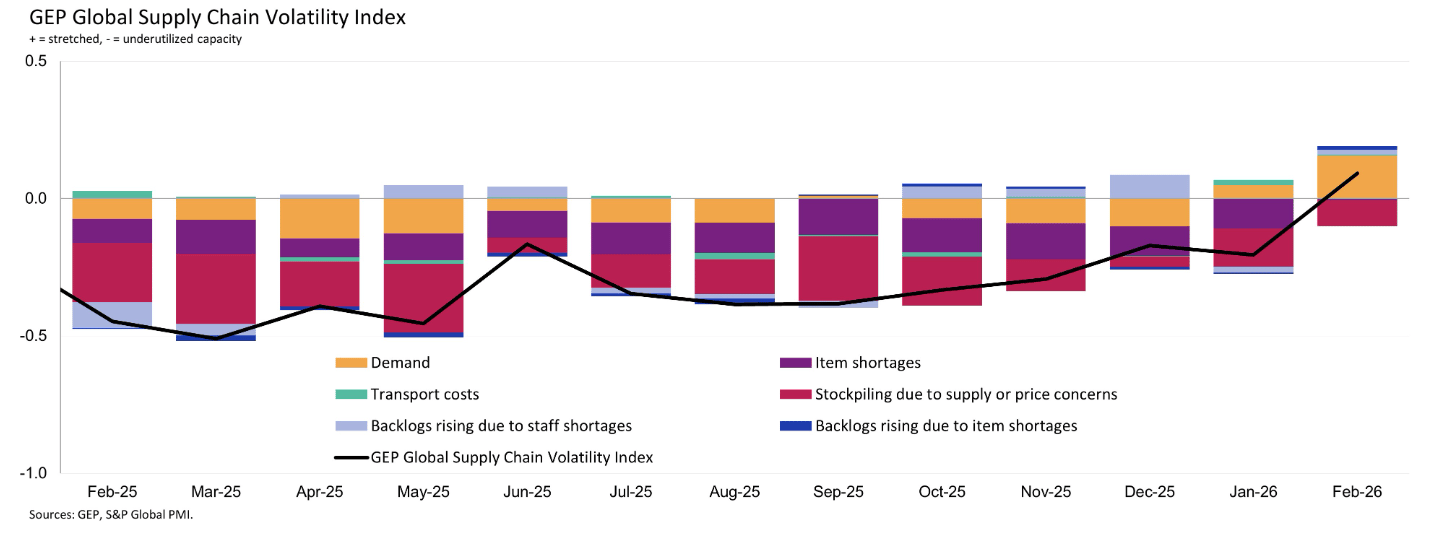
Click Chart To See Full Index
The GEP Global Supply Chain Volatility Index, produced by S&P Global and GEP, is a leading indicator derived from monthly surveys of approximately 27,000 businesses across 40+ countries, tracking demand conditions, shortages, transportation costs, inventories, and backlogs. A reading above zero signals that supply chain capacity is being stretched and volatility is increasing; a reading below zero indicates underutilized capacity and lower volatility.
Note: The March 2026 data has not been released at time of writing tomorrow, we will incorporate the updated reading in next month's edition.
The February data showed worldwide purchases of raw materials, commodities, and critical components rising at the fastest pace in nearly four years, driven almost entirely by a surge in Asian manufacturing activity with China, Japan, India, South Korea, and Taiwan collectively recording their busiest month in three and a half years. North America, however, told a different story, with factory input demand softening and contracting, reflecting a cooling of U.S. manufacturing growth even as global activity accelerated. For small and mid-size manufacturers in the Mid-Atlantic region, this divergence is worth watching closely as strong Asian demand tightening global supplier capacity can translate into longer lead times and less pricing leverage on imported components, even when domestic demand feels soft. With the Middle East conflict now adding freight and energy disruption on top of this demand-driven tightening, the supply environment heading into Q2 is more constrained than the domestic PMI numbers alone would suggest.
🌍 Global Hot Topic: China Enacts First-Ever Supply Chain Security Law (Click To Read Article)
On April 7, China's State Council released its first-ever comprehensive supply chain security regulation which is an 18-article framework that took effect immediately with no transition period. The rules give Chinese government agencies broad authority to launch security investigations against foreign nations, organizations, and companies if they impose trade restrictions on China, comply with foreign sanctions in ways that disrupt Chinese supply relationships, or attempt to reconfigure supply chains away from China for geopolitical reasons. Notably, multinational companies operating in China are now required to report "supply chain security incidents" including responding to foreign sanctions or export controls directly to Chinese authorities, effectively creating a real-time visibility window into how global companies are managing their China exposure.
For U.S. manufacturers sourcing from China or operating within Chinese supply networks, this is not background noise it is a direct compliance and risk event. Companies that have been quietly diversifying away from Chinese suppliers or applying foreign export controls could now face formal investigations and retaliatory measures including trade restrictions, cooperation bans, and market access limitations. If you have not yet mapped your China-sourced components and assessed your exposure, now is the time to do it.
🇺🇸 US Hot Topic: Trump Restructures Section 232 Tariffs on Steel, Aluminum, and Copper — Effective April 6 (Click To Read Article)
The Trump administration signed a proclamation on April 2 restructuring how Section 232 tariffs on steel, aluminum, and copper are calculated with new rules taking effect April 6. The biggest change is the shift to a full-value basis: goods made almost entirely of these metals, including steel coils and aluminum sheets, now face a 50% tariff on their total value, replacing the prior method that only taxed the metal content portion. Derivative articles substantially made of these metals like steel cooking appliances, semi-trailer trucks, and diesel-engine trains face a 25% tariff, while a new 15% rate applies to certain metal-insensitive industrial and electrical grid equipment. Critically, the administration has also terminated the existing process for adding derivative products to the metal tariff list, handing that determination to cabinet officials on a rolling basis meaning the scope of what gets tariffed can now change at any time with little notice.
For small and mid-size manufacturers buying steel, aluminum, or copper components like brackets, housings, fasteners, fittings, and stampings this is a direct cost event that is already in effect. The move from content-based to full-value tariff calculation can significantly increase the effective rate on fabricated parts, and the open-ended authority for future additions means your exposure could expand without warning. Now is the time to audit your imported component list, understand which tariff bucket each part falls into, and evaluate whether domestic sourcing alternatives can close the gap. This is exactly the kind of sourcing challenge Ena Source helps manufacturers navigate, reach out if you want a fresh set of eyes on your exposure.
📈 Ena Monthly Stock Pick
$COST– Costco Wholesale Corporation has been one of the standout performers in an otherwise turbulent 2026, up approximately 19% year to date even as the broader market has sold off. Costco's membership-based model is uniquely resilient in uncertain times with over 81 million members and renewal rates above 90%, the company generates predictable cash flow regardless of what the economy is doing, and cost-conscious consumers tend to lean harder into Costco when budgets tighten.
As always, it’s not about timing the market, it’s about time in the market
Disclaimer: This is not financial advice or a recommendation for any investment. The content is for information purposes only, you should not construe any such information or other material as legal, tax, investment, financial, or other advice.
🚀 Your Supply Chain, Your Competitive Edge
Most manufacturers we talk to are leaving money on the table not because they aren't smart, but because sourcing is time-consuming, relationships get comfortable, and there's always something more urgent to deal with. That's exactly where we come in. Ena Source works as an embedded extension of your team, finding better suppliers, negotiating better prices, and building the kind of supply chain that stops being a problem and starts being an advantage. We work with small and mid-size manufacturers across the Mid-Atlantic, and our first conversation is always free.
📩 If something in this newsletter hit close to home, that's a good reason to reach out. Click here to book a meeting.
Check Out Previous Newsletters At Our Website!
