- Ena Source Monthly Newsletter
- Posts
- Monthly Supply Chain Pulse - 25
Monthly Supply Chain Pulse - 25
📰 Supply Chain Pulse | Monthly Edition – December 8, 2025
Your Go-To Source for Supply Chain Insights, Trends, and Actionable Advice
Happy holidays from the Ena Source team! Relax and enjoy the time with your friends and families! 🎄✨
Follow us on LinkedIn!
Our LinkedIn page is now live! We are delivering valuable insight and perspective on supply chain management and sourcing to help our followers stay sharp and build resilient supply chains along the way!
Published Guide With MANTEC
We partnered with MANTEC to publish a practical guide on how today’s tariff changes hit pricing, lead times, and cash flow. Take a look at our 8-step roadmap to strengthen your supply chain! Click here!
Supply Chain Health Survey
We’ve launched a quick and free Supply Chain Health Survey that gives you a clear score so you can understand how healthy your supply chain is! Click here to take the survey!
📊 Key Metrics
Staying competitive means keeping an eye on the data that matters most. Here are five supply chain metrics that we monitor and will provide updates on within each newsletter.
🛳️ Drewry World Container Index (WCI)

Click Chart To See Full Table
What to consider: The 40ft rate from Shanghai to New York dropped 24.5% (from $3,837 to $2,895) this past month, signaling softer demand and looser capacity. Likely drivers include tariff headwinds dampening China originating orders and the post peak seasonal slowdown.
🚚 DAT Truckload Freight Rate Index

Click Chart To See Full Index
Why it matters: Van spot rates climbed to $2.21/mile from $2.10/mile, signaling tighter capacity as holiday flows, regional imbalances, and early winter weather absorb excess trucks. Expect choppier week-to-week pricing and longer lead times on key lanes.
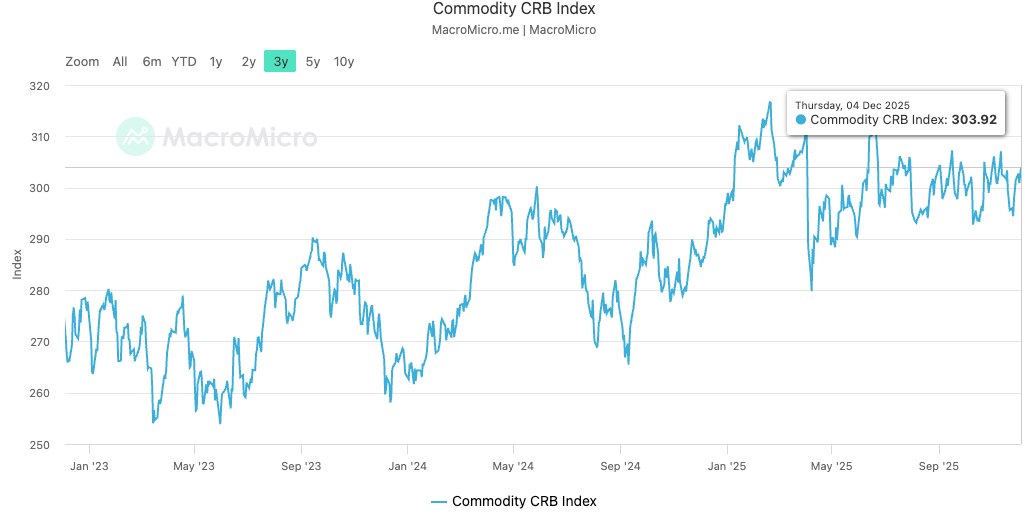
🛢 Commodity Research Bureau (CRB) Index
Click Chart To See Full Index
The CRB index measures a basket of 19 commodities including energy, agriculture, and metals. It’s widely considered a leading indicator of inflation, economic health, and overall cost trends for goods across the market. An increase tends to signify an increase in economic activity while a decrease tends to signify a slowdown in economic activity.
Why it matters: The CRB Index is still holding tight, continuing to show a trend of stability. This remains a good time to lock in pricing with your suppliers and evaluate your inventory on hand.
🇺🇸 🏭 Philadelphia Fed Manufacturing Index

Click Chart To See Full Index
To create this index, the Federal Reserve Bank of Philadelphia surveys around 250 manufacturers, asking about factors like employment, working hours, new and unfilled orders, shipments, inventory levels, delivery times, prices, costs, and business forecasts for the next six months. An index level above zero signifies improving conditions, while a level below zero indicates worsening conditions. Read more here.
Why it matters: The index improved to −1.7 from −12.8, signaling contraction is potentially easing and conditions are drifting back toward break-even. Readings hovering around zero typically mean choppy order books, tighter pricing power, and month-to-month volatility rather than a clear trend. At this point, there is no real trend emerging.
What to consider: As expected, the reading for this month has corrected itself a bit over last months. This still is a good time to cut back on non-essential inventory and to focus on risk mitigation in your supply chain.
🧾 Purchasing Managers Index (PMI)

Click Chart To See Full Index
The PMI is an economic indicator derived from monthly surveys of private sector companies, measuring the performance of the manufacturing and services sectors. It covers metrics such as new orders, inventory levels, production, supplier deliveries, and employment. A PMI above 50 indicates expansion, while below 50 suggests contraction.
Why it matters: The PMI slipped to 48.2, still showing a minor contraction. Sub-50 readings this long usually mean order intake is soft, backlogs are being worked down, pricing power is thin, and customers push shipments to next quarter. These are conditions that typically compress margins if you don’t rebalance costs.
What to consider: Renegotiate now with your suppliers for price reductions, MOQ cuts, shorter lead times, and 30–60 day holds. Tighten PO intervals and reduce on-hand inventory by clearing slow movers to free cash. This is also a great time to work on improving your service levels to make sure you keep your customers happy!
🌍 Global Hot Topic: Manufacturing weakens in Europe, Asia on faltering demand and tariff uncertainties(Click To Read Article)
Global manufacturing softened in November across several major economies. The U.S., eurozone, China, and Japan all posted contractionary readings as new orders weakened and tariff uncertainty weighed on planning. Germany saw the sharpest deterioration in the eurozone, with faster job cuts and a steep drop in orders. U.S. factories registered a ninth straight month of contraction, China slipped back into slight contraction with high inventories and continued price pressure, and Japan’s orders extended their multi-year decline.
There were offsets though, where the U.K. returned to growth, Italy edged back into expansion, and Southeast Asia outperformed, with Indonesia and Vietnam growing and Malaysia rebounding. South Korea remained contractionary on PMI but logged a sixth consecutive month of export growth led by semiconductors and autos. The net picture is a two-speed environment showing a soft demand in advanced hubs and improving momentum in select emerging markets.
🇺🇸 US Hot Topic: US manufacturing slump deepens in November (Click To Read Article)
Manufacturing contracted for the ninth straight month in November as ISM’s PMI fell to 48.2 (from 48.7). New orders dropped to 47.4 and factory employment fell for a 10th month, while supplier deliveries accelerated (49.3) and prices paid rose to 58.5. The Fed’s Beige Book flagged weaker consumer spending and ongoing tariff uncertainty; policy risk remains elevated with potential Supreme Court action and shifting U.S.–China trade tactics.
Why It Matters:
Plan for lighter demand with sticky input costs. Reprice tariff exposed SKUs, confirm HTS codes/country of origin, and insert tariff adjustment language in contracts. Use the softer order pace to renegotiate MOQs, lead times, and surcharges. Line up alternate source options in allied countries, dual-source critical parts, and pre-buy only where price stability and storage economics pencil out. This is precisely where Ena Source can help out through our global network of fully vetted manufactures across many industries!
📈 Ena Monthly Stock Pick
$MOAT– VanEck Morningstar Wide Moat ETF consists of businesses with durable competitive advantages, strong cash flows, and pricing power. This portfolio is then then refreshed quarterly to favor those trading below fair value. The quality plus valuation approach is built for steadier compounding, helping reduce headline risk and earnings shocks. With roughly 50 holdings and no single name outsized bets, MOAT offers a simple way to own resilient franchises without overpaying, which is useful when markets are choppy but fundamentals still matter.
As always, it’s not about timing the market, it’s about time in the market
Disclaimer: This is not financial advice or a recommendation for any investment. The content is for information purposes only, you should not construe any such information or other material as legal, tax, investment, financial, or other advice.
🚀 Your Supply Chain, Your Competitive Edge
Supply chains aren’t just about logistics, they’re about your bottom line, your growth, and your ability to outpace the competition. At Ena Source, we don’t just find suppliers; we engineer strategic supply chain solutions that cut costs, build resilience, improve reliability, and free up your cash flow.
If you’re curious how much you could be saving, let’s talk. No pressure. No cost. Just clarity.
📩 Click here to book a meeting. Resilient supply chains don’t happen by chance, they happen by choice. Let’s build yours, strategically.
Check Out Previous Newsletters At Our Website!
